I recently completed a Data Science course and wanted to review Principle Component Analysis (PCA) to develop my skills in understanding data variables highly correlated to the independent variable.
What is Principle Component Analysis (PCA)?
PCA is an ordination statistical method that reduces the dimensionality of multivariate data by creating a few new key explanatory variables called principal components (PCs). It’s mostly used as a tool in exploratory data analysis and for making predictive models.
For now, I’ll use PCA to evaluate the principal components of the Iris dataset. And later on I anticipate utilizing the methodology as part of a process of developing both a churn model and to predict customer lifetime value.
Iris Flower Data Set
The Iris Flower dataset is a multivariate set of 150 observations covering 3 flower species collected from various regions across four features; the width and length of the sepals and petals. It was initially introduced by the British statistician and biologist Ronald Fisher in 1936 and remains a very common practice set for data science (click here for more info). The data quantifies the morphologic variation of Iris flowers of three related species. Two of the three species were collected in the Gaspé Peninsula, all from the same pasture, and picked on the same day and measured at the same time by the same person with the same apparatus.
My analysis for this dataset will be to determine the key explanatory variables using PCA and the taking the following steps in R (click here to see R code):
- Installing the caret package and library
- Loading the Iris dataset
- Transforming the data to normalize the variables using Log Scale
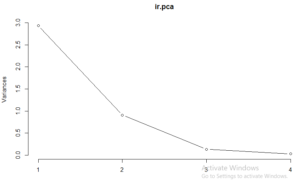
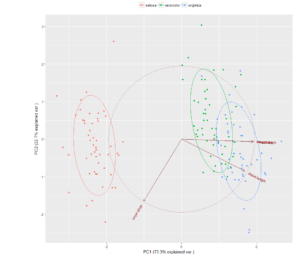
- Running the PCA function and plotting the results
- Analyzing the results
Analysis
Here are 2 tables of output from running the PCA function in step 4 above:
Table 1 – Summary of Iris PCA Object

Table 2 – PCA Object Standard Deviation and Coefficients


Observations
- Clearly shows PC1 explains 73% of coefficient variation, combined 95.99%
- Sepal Length and both of Petal variables drive correlations
- PC1 indicates most of where the correlation lies.
- PC1 also explains variability and correlation to Sepal Length
The Setosa flower is clearly different from the Versicolor and Virginica which could possibly be explained by the pollination process or some other variable.


Nice post!
These are genuinely great ideas in on the topic of blogging.
You have touched some pleasant things here. Any way keep up wrinting.